Examples
Cosma is used by teachers, students, researchers, librarians, designers, journalists… Any kind of knowledge work which involves describing things and the relationships between them can make use of Cosma.
Here are a few examples of common use cases. For each one, click on the first image to interact with the example in your browser.
About these examples
The interactive examples linked on this page are “cosmoscopes”. This is how we call the files that Cosma creates from your data. These are self-contained HTML files, so they can be shared and used as is: you only need a web browser to open them. And if you want to make them public, you just need a little corner of the Web to upload your files to.
Creating a hypertextual glossary
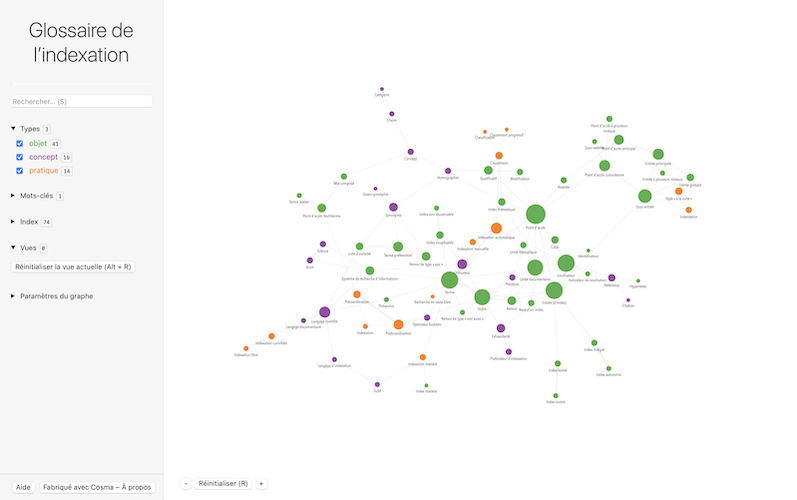
A glossary can be an invaluable resource for both newcomers and established professionals in any field, providing a shared vocabulary with definitions.
By glossary, we usually mean an alphabetical list of definitions. But in many glossaries, definitions reference each other, and it’s very useful to keep track of these links. If we put each definition in a text file with [[wiki links]] pointing to the others, we can visualize the glossary as a graph with Cosma.
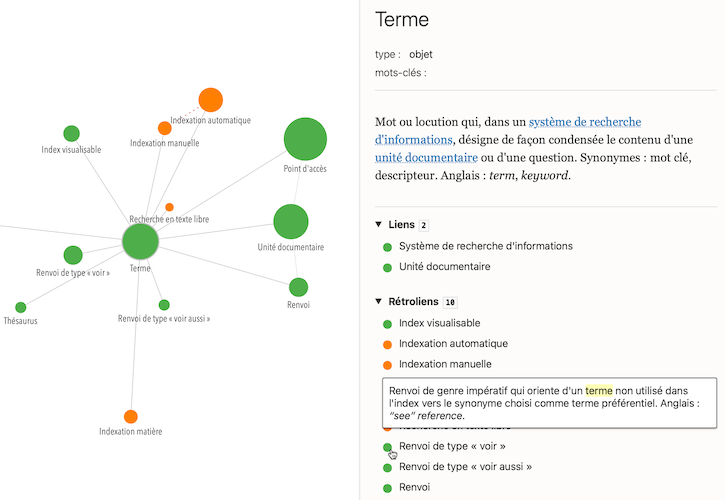
For each entry, Cosma adds a list of contextualized backlinks below the text: this tells you where the term appears elsewhere in the glossary, with the surrounding paragraph for context. This helps us understand how the terms relate to one another, and improves the usefulness of the glossary as a resource.
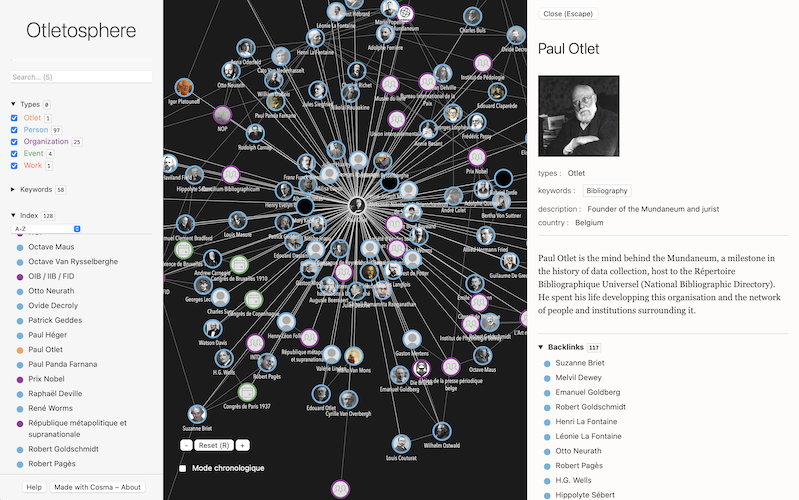
Studying a network of social relationships
When working on a topic, we often start with a list, then move on to either tables (in a spreadsheet, a database) or diagrams (such as mind maps). But why not both?
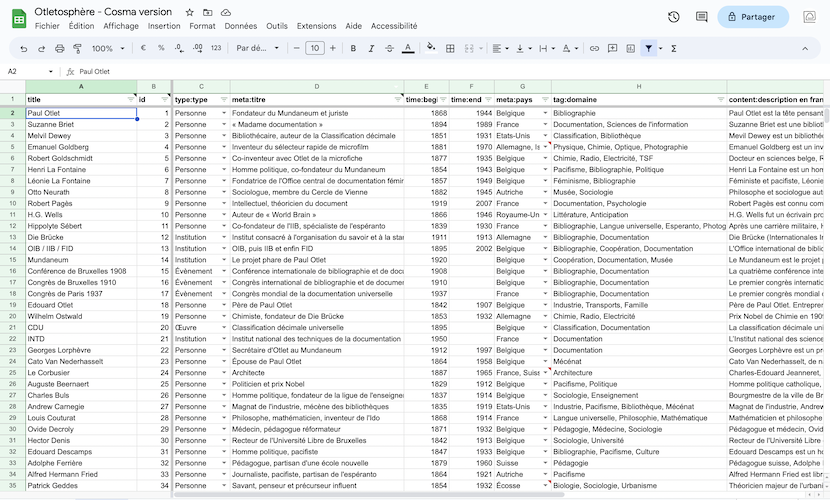
An online collaborative spreadsheet (such as Google Sheets) makes it easy to work together on a list of things (people, organizations, events…) with various metadata (dates, keywords, country of origin, Wikipedia links…).
Saving this knowledge base as a CSV file allows us to visualize it with Cosma, which provides a convenient interface to review the data:
- Having portraits of people in the graph is a powerful visual affordance.
- Reading descriptions is much more pleasant in Cosma than in a spreadsheet.
- Isolated nodes (not linked to anything) can be spotted right away.
- And the index, search and display filters help to quickly switch from a global context (seeing the whole network) to a local one (focusing on specific entities).
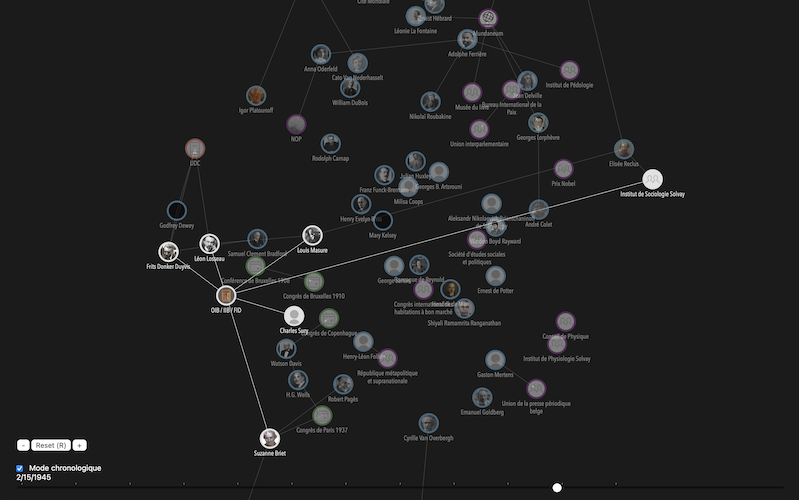
In version 2.0 of Cosma, we introduced a chronological mode which filters the display according to time metadata. This is a first step in providing more time-based features, making Cosma more useful for doing things like reconstructing historical networks.
Citations as links
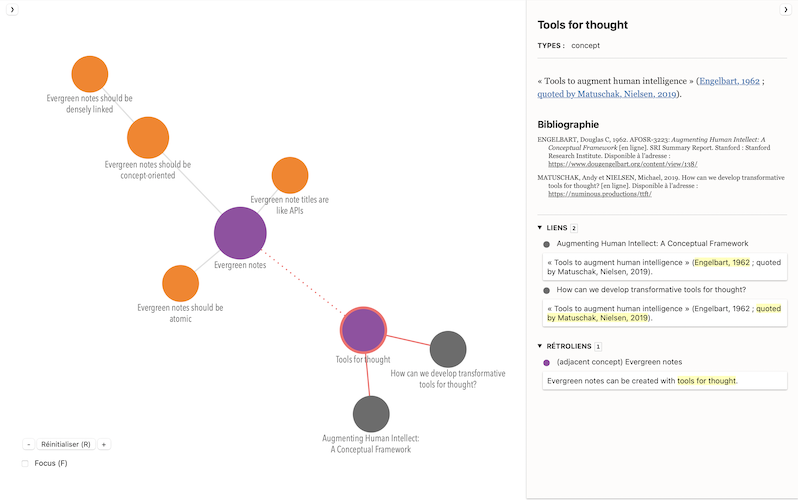
Cosma recognizes citations of bibliographic references in the Pandoc syntax, and formats them according to the bibliographic style of your choice, e.g. [@engelbart1962, 4] becomes « (Engelbart 1962, p. 4) ».
In version 2.2 of Cosma, we added an option to display these references as nodes in the cosmoscope. When activated, this options means that each reference cited in your files becomes a node, and each citation becomes a link to that node.
Mapping scientific production
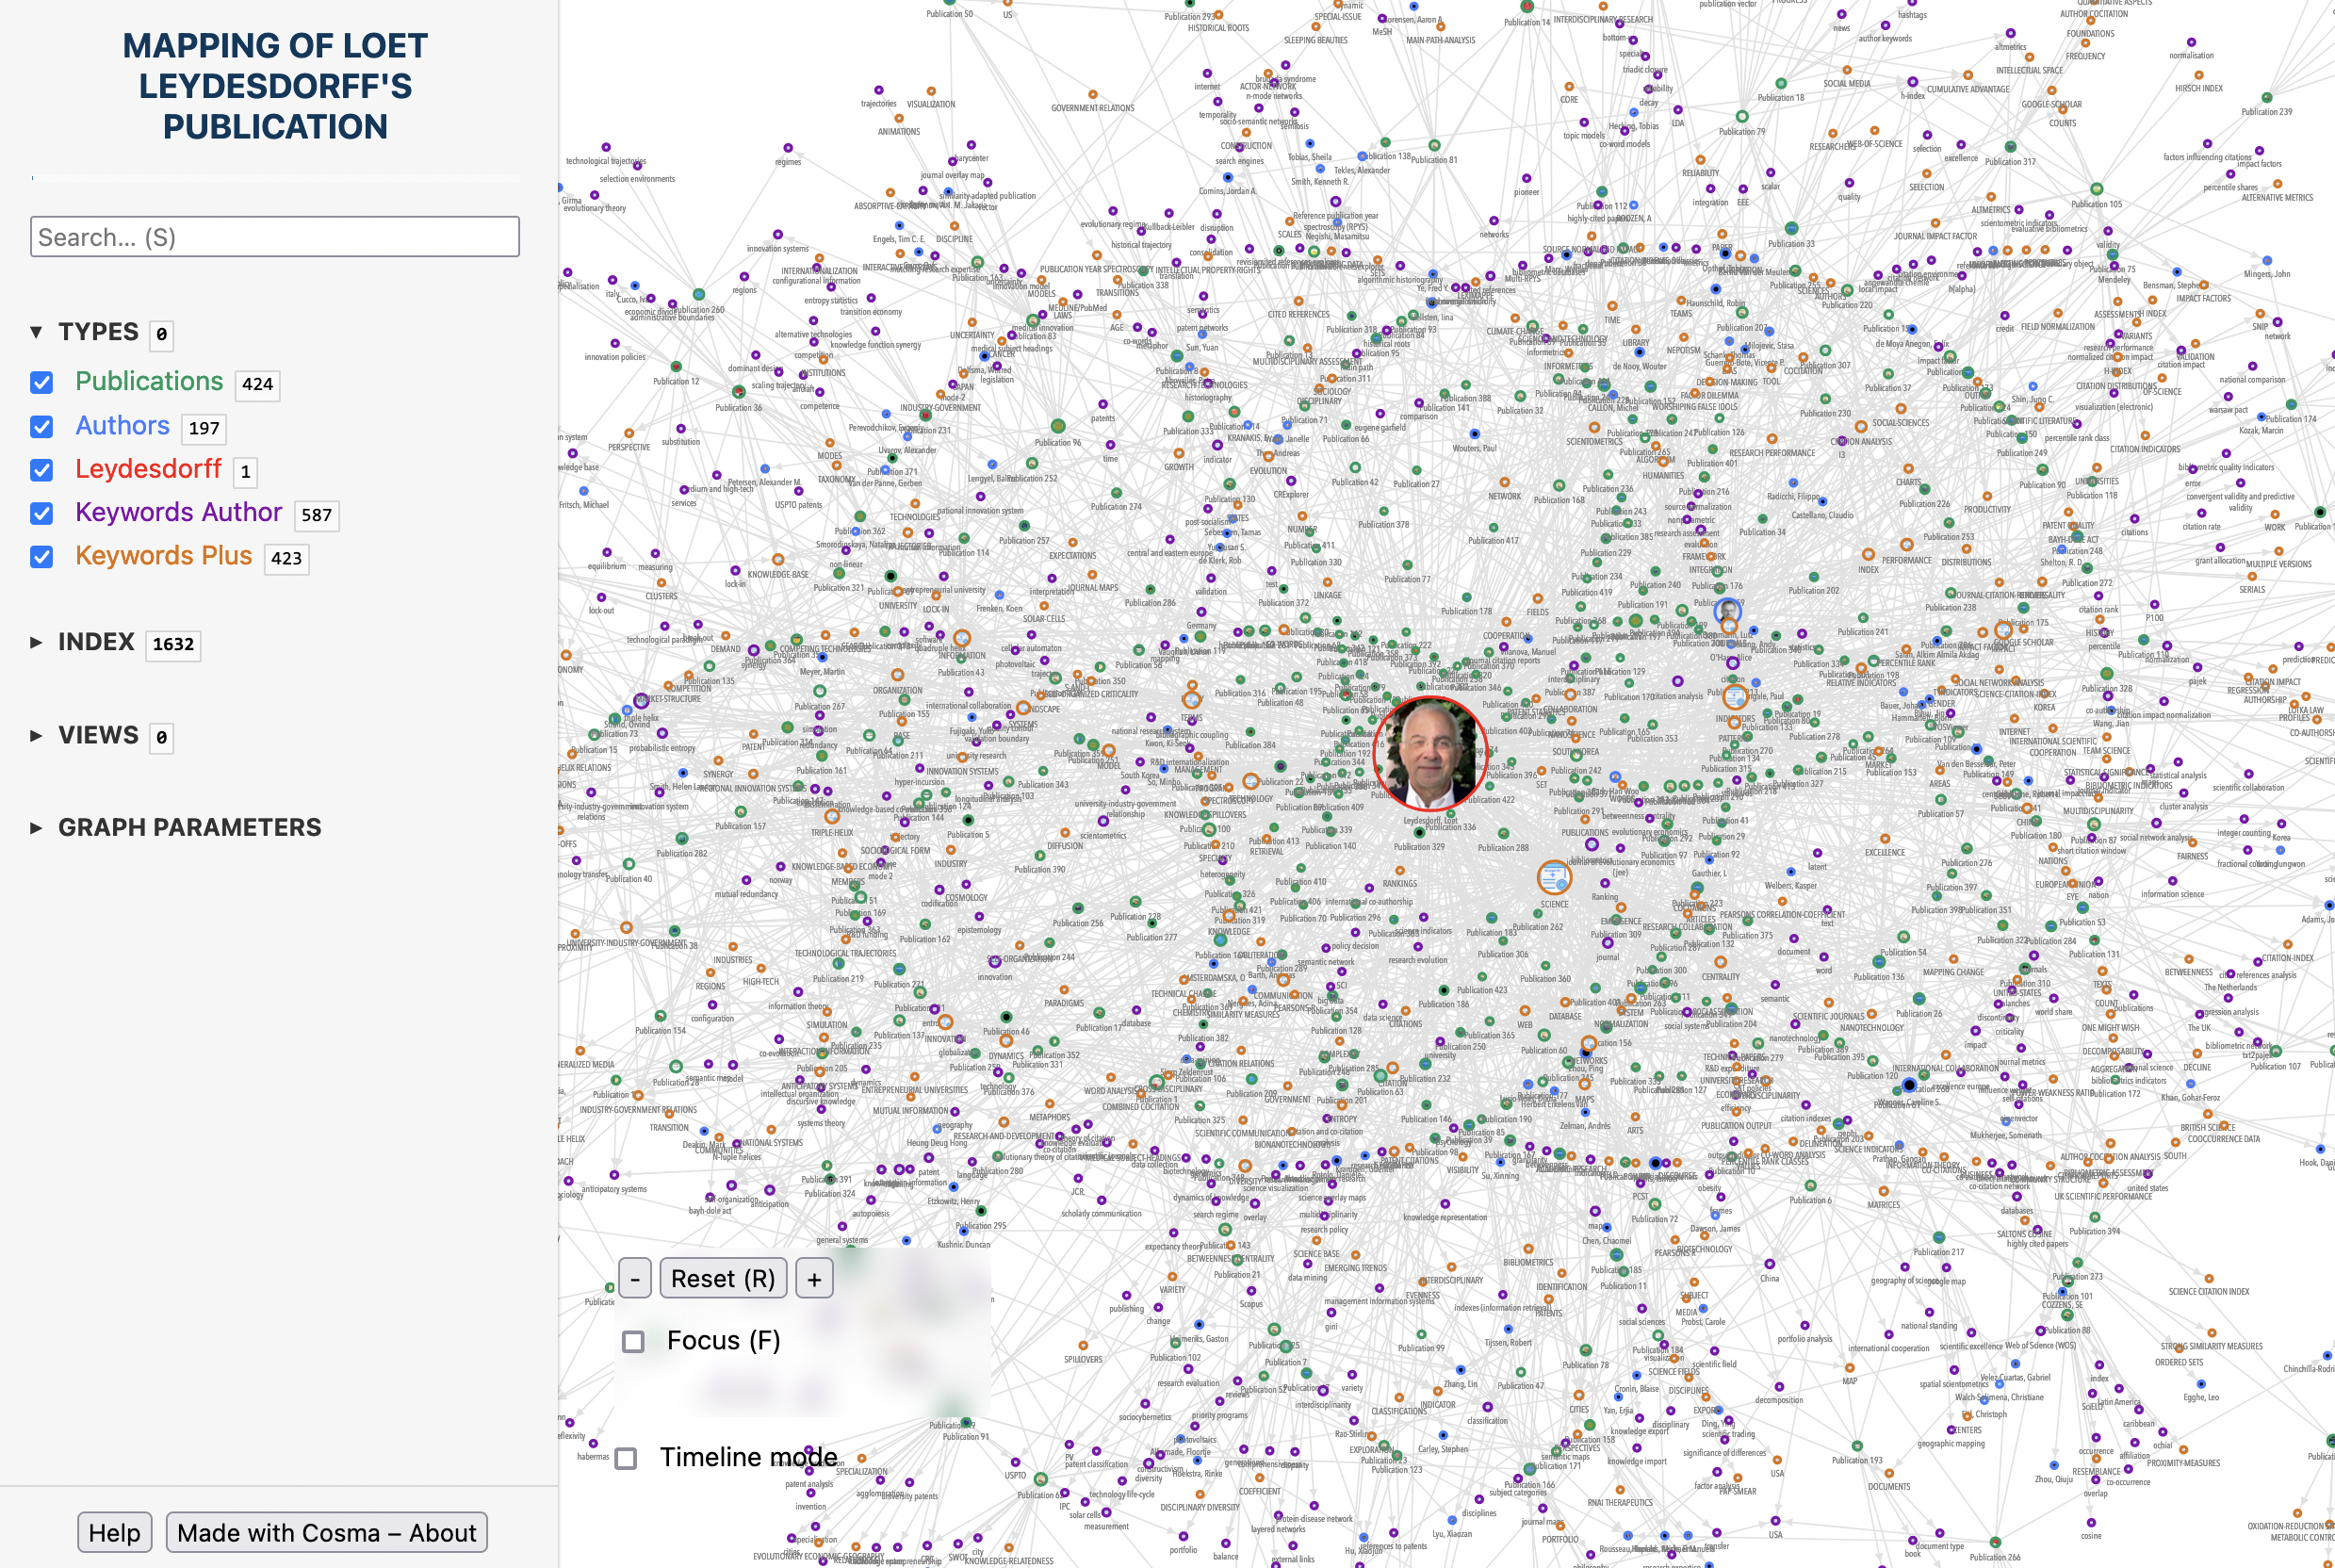
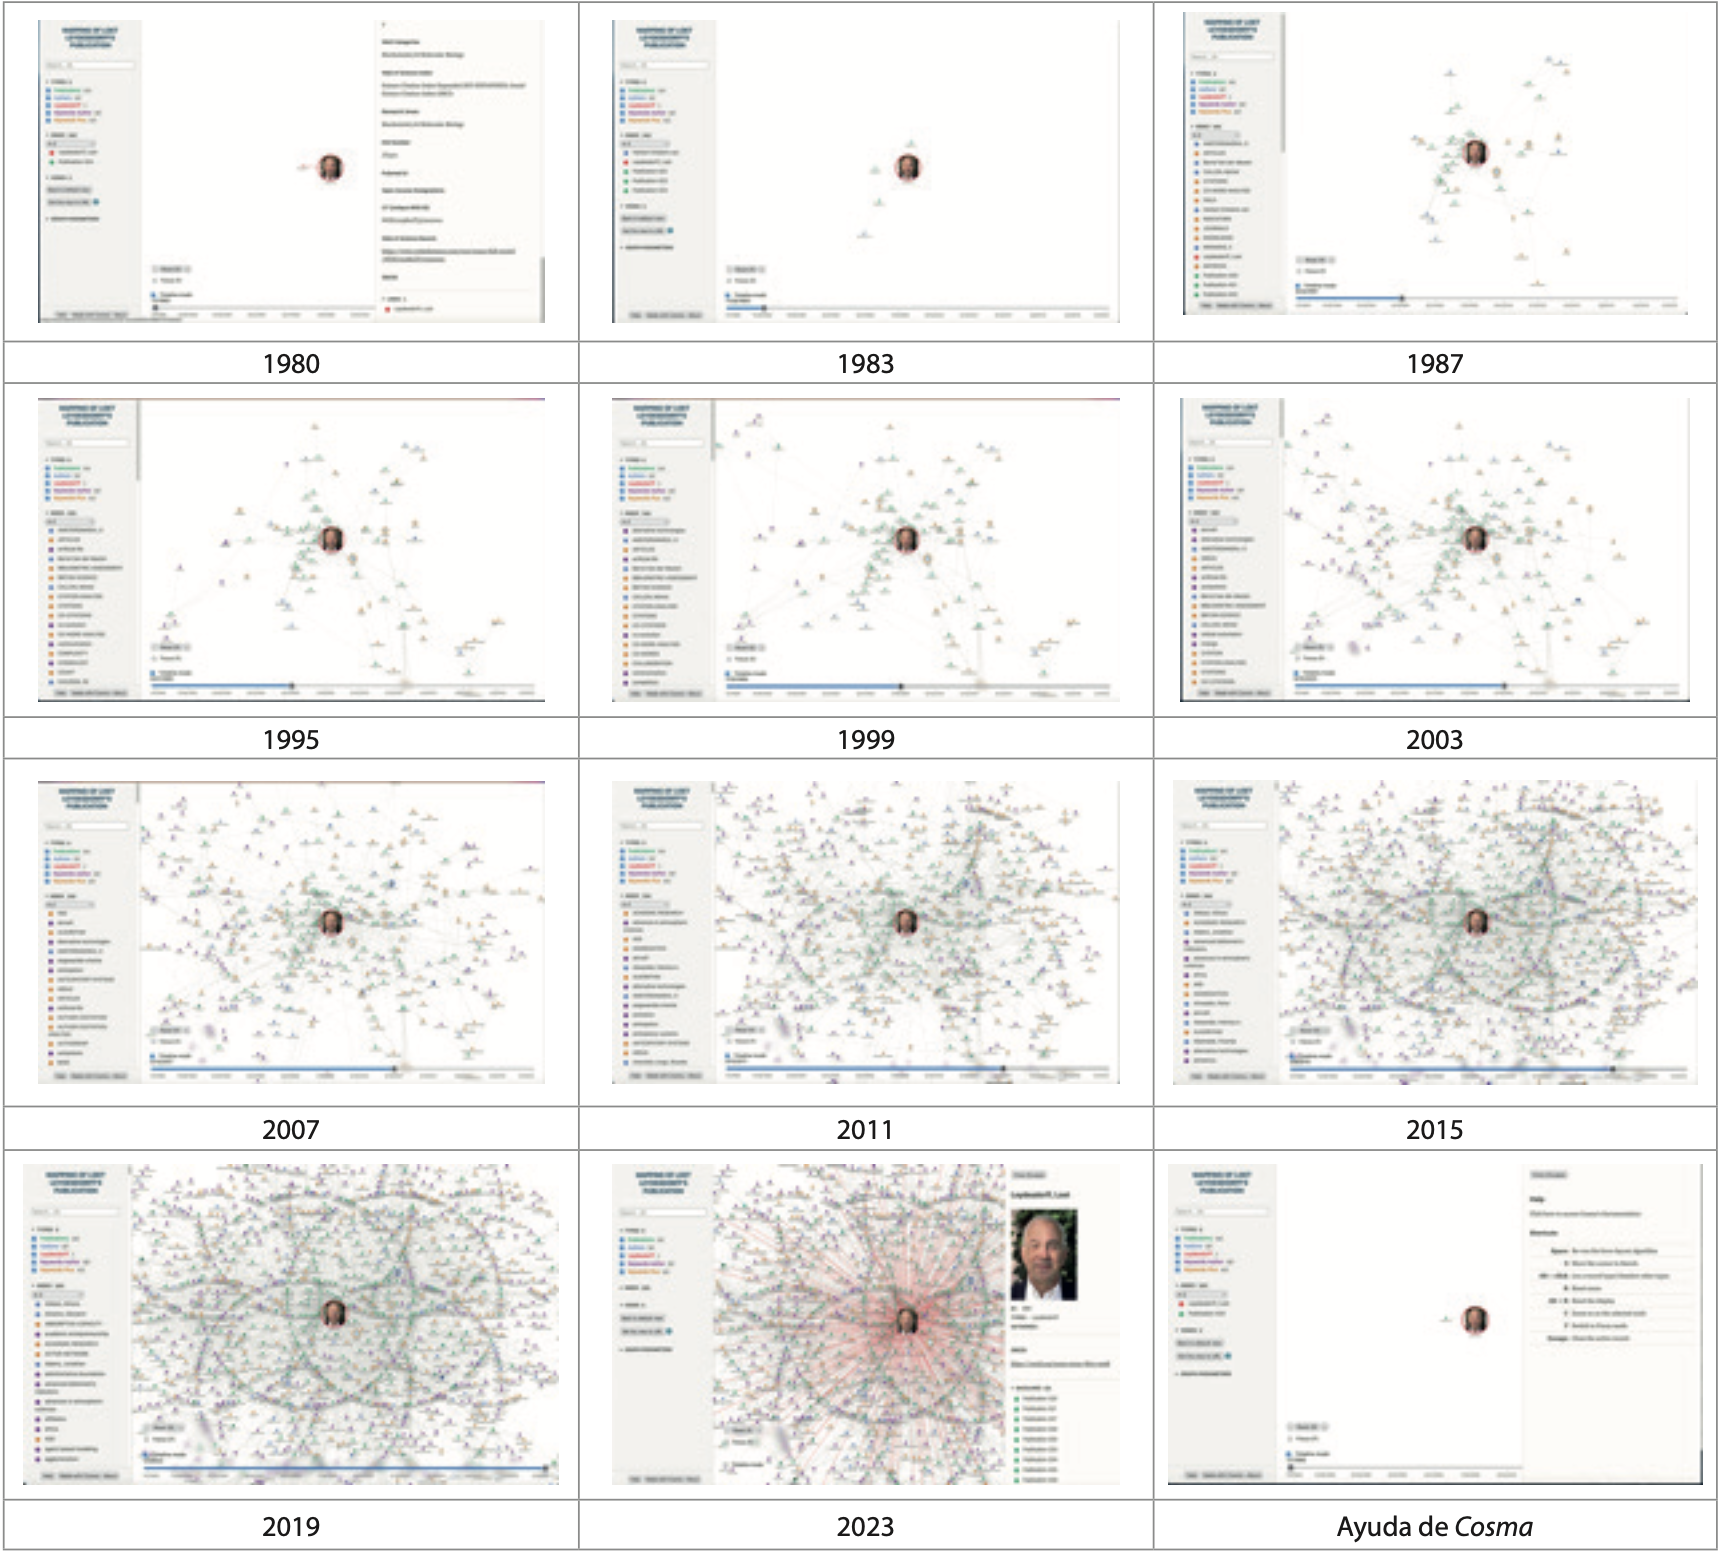
A team of researchers have published a paper in which they use Cosma (among other tools) to map the scientific production of Dutch cyberneticist Loet Leydesdorff: “a visual representation of how disciplines, fields, documents, co-authors, author words and index words (keywords plus) relate to each other in Leydesdorff publications”. Cosma’s chronological mode is used to navigate through the data year by year.
Researching a complex topic
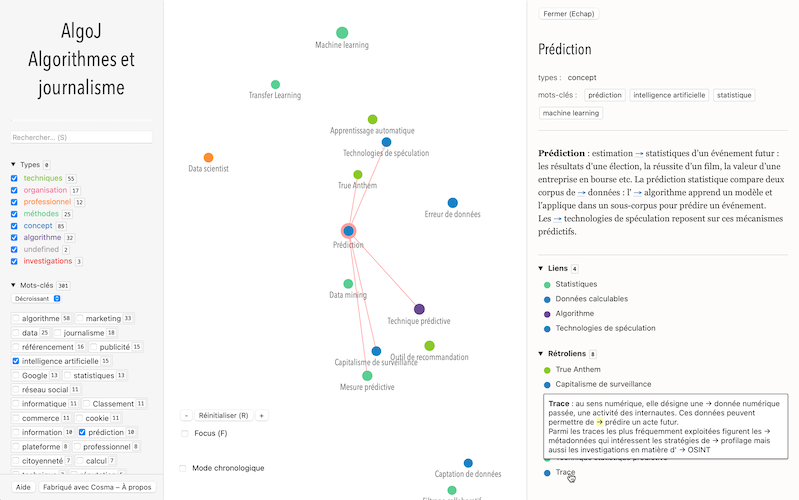
Research usually involves gathering materials, taking notes about them, and forging new insights. You analyze existing things (= break down the topic into smaller parts), then synthesize new things (= combine these smaller parts in different ways, sometimes invent new parts altogether).
To support this process, academics have used non-linear documentation for centuries. It started with commonplace books, where you would gather useful quotes and add a back-of-the-book index to group them under subject headings. It continued with index cards, then databases. And it goes on today, with web technologies providing us new interfaces to support this kind of work.
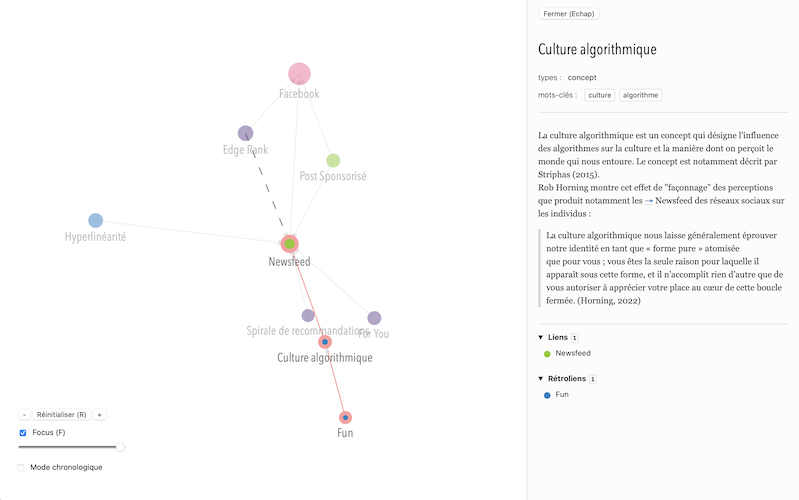
Cosma encourages you to do knowledge work. Classify things by using types and keywords: Cosma will give you navigational affordances (colors, filters). Engage with concepts and literature: Cosma gives you contextualized backlinks to remind you of past insights, helping you create new ideas.